Australian House Prices Are Now Nine Times Income: Here's the Maths
Sep 21, 2026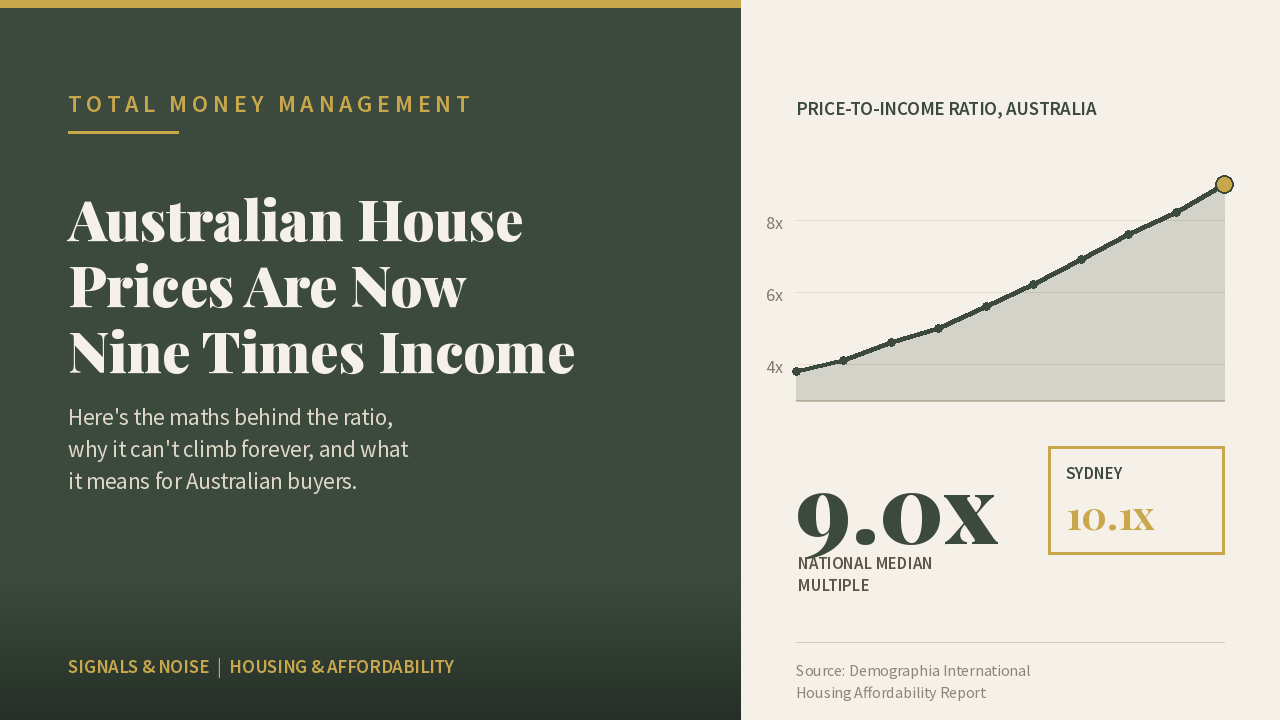
Every few months the same argument resurfaces: house prices are too high, or house prices are fine because "Australians always find a way." Neither version is a number. Total Money Management prefers the number. As at late 2025, Australia's national median house price to median household income ratio sits at 8.2, climbing toward nine, and Sydney is already past ten. Here is what that ratio actually measures, why it cannot rise forever, and what the data says without the narrative attached.
What Does a Price-to-Income Ratio of Nine Actually Mean?
The ratio is simple: take the median house price in a city or country and divide it by the median household income. Demographia's international housing affordability research uses this exact measure to rank cities globally, and classifies anything above five as unaffordable and anything above nine as "impossibly unaffordable."
- National median multiple: 8.2. Already in severely unaffordable territory, and among the worst of any developed economy Demographia tracks.
- Sydney median multiple: 10.1. A median Sydney home now costs more than ten years of the median household's entire income, not what is left after tax, rent, and everyday expenses.
- Combined capital city median house price: above $1.1 million. On current numbers, a single buyer on the average full time income needs roughly thirteen years to save a 20% deposit alone.
- Affordability collapse: from 43% to 14%. The share of median income households who can afford the median priced home nationally has fallen from 43% just three years ago to around 14% today.
"A ratio only tells you where you are relative to history. It doesn't tell you when the correction comes, or which direction it runs. That's the part people skip past to get to the headline."
Why Can't the Ratio Just Keep Climbing?
Prices and incomes are connected by a hard constraint: someone has to be able to borrow the money and service the debt. Income sets the ceiling on how much a household can safely borrow, and interest rates set how expensive that debt is. When the price-to-income ratio outpaces both wages and borrowing capacity, something eventually gives: prices stall, incomes catch up, rates fall enough to make the debt serviceable, or policy shifts who is buying and how.
This is not a call on timing. Nobody can say with precision when a stretched ratio resolves, and treating this like a market-timing signal misses the point. What the data shows is that the current level is stretched by historical and international standards, and stretched ratios have not historically been permanent conditions.
The Herengracht Lesson: Real House Prices Don't Compound Forever
One of the longest-running house price datasets in the world tracks the Herengracht canal in Amsterdam across roughly 400 years. Its central finding is unglamorous but useful: after adjusting for inflation, real house prices in that dataset moved through long cycles of boom and stagnation rather than compounding upward in a straight line. Multi-decade windows of strong real growth were followed by multi-decade windows of going nowhere in real terms. A national ratio near nine, and a Sydney ratio past ten, is consistent with being late in one of those windows, not with a new permanent plateau.
What the Deposit Problem Compounds Into
A high price-to-income ratio doesn't just strain monthly repayments. It turns the deposit itself into a multi-year project for anyone without existing equity or family help.
- Government deposit schemes shorten the timeline, not the price. The 5% deposit scheme can cut years off the saving period, in some cases more than five years in Sydney.
- Lower deposits mean more debt, not less exposure. Schemes that let buyers enter with a smaller deposit shift who carries the price-to-income maths and how much leverage they carry into it; they don't change the ratio itself.
Want the framework we use to think about asset prices relative to fundamentals across markets, not just property? Our free ETF course walks through how we assess value before we assess a story. Start the free ETF course here.
Should You Treat a Stretched Ratio as a Reason to Buy or Wait?
This is a personal decision, not a general call, and a ratio on its own doesn't make it for you. What it can do is sharpen the two positions people actually argue from:
- Choose to buy now if you have a long time horizon, a stable income, and the purchase fits a broader plan regardless of where the ratio sits in five years. Waiting for a "correct" ratio has an opportunity cost of its own, and nobody can time the resolution.
- Choose to wait if you are stretching serviceability to the edge to buy at today's multiple, or the purchase depends on prices or rates moving in your favour to work. A ratio this extreme means the margin for error is thinner than it has been in decades.
Numbers Over Narrative
Nine times income is not just a big number. It describes a genuine constraint between what people earn and what they are being asked to pay, and constraints like this have not historically been permanent. Whether the adjustment comes through prices, incomes, interest rates, or policy is the open question. Total Money Management exists to help you sit with what the data actually says, rather than reacting to whichever headline about record prices ran this week.
Frequently Asked Questions
What is considered an affordable house price-to-income ratio?
Demographia's international benchmark treats a ratio of three or below as affordable, four as moderately unaffordable, five as seriously unaffordable, and anything above nine as impossibly unaffordable. Australia's national ratio is now approaching that top category, and Sydney has already passed it.
Has Australia's price-to-income ratio been this high before?
No. A national multiple near nine, with Sydney above ten, is historically extreme by both Australian and international standards, and sits well outside the range Demographia has recorded across its multi-decade dataset of major English-speaking housing markets.
Does a high price-to-income ratio mean a crash is coming?
Not necessarily, and not on any predictable timeline. A stretched ratio tells you the current relationship between prices and incomes is historically unusual. It does not tell you when or how it resolves, and treating it as a timing signal is a different exercise to understanding the underlying maths.
How is the price-to-income ratio different from mortgage stress?
The ratio measures the purchase price against income, mainly a deposit and borrowing-capacity problem. Mortgage stress measures ongoing repayments against income after the purchase, which is also affected by interest rates. A household can face pressure on both fronts at once, or on only one.
We go deeper on the maths behind market moves like this every week in Signals & Noise, our free weekly newsletter, and in our piece on stocks versus property as long-term Australian investments. We also unpack topics like this in more depth on the TMM podcast. For the full historical detail behind the figures in this piece, see Demographia's International Housing Affordability report.
If you want ongoing coverage of what the data says as this ratio moves, not just a one-off post, our premium community covers housing, equities, and rates every week with the same numbers-first approach.
This newsletter is for informational purposes only and does not constitute financial advice. Total Money Management | AFSL 568642.
Enjoying our blog?
Join Signals & Noise, our free weekly newsletter, and stay sharp on the markets and sectors we're tracking.
This newsletter is for informational purposes only and does not constitute financial advice. Total Money Management | AFSL 568642.
Stay connected to our blog
Join our mailing list to receive the latest news and updates from our team including blogs, live events, podcast releases and stocks to watch.
Your information will not be shared.
We hate SPAM. We will never sell your information, for any reason.
