Oil at $100: Is This 1990 Again, or the Start of a 2000s Run?
Sep 22, 2026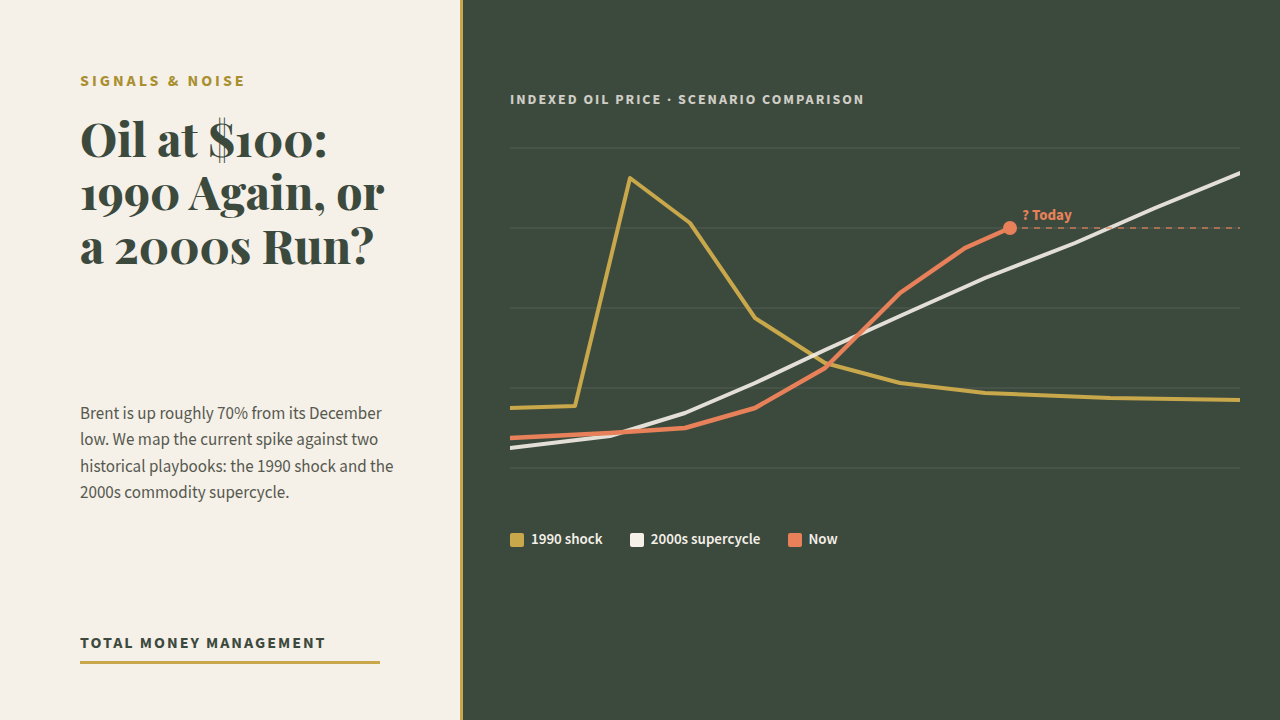
Oil is up about 70% from its December low. Scenario thinking shows why the risks lean up, even though most outcomes sit at or below today's price.
Oil is back near US$100 a barrel. Brent settled at $103.87 on September 18, and US crude closed just under $100 on Monday, roughly 70% above its December low of about $59. The question is whether this is a short geopolitical spike like 1990, or the start of a longer run like the 2000s.
Why it matters even if you don't own oil
Energy prices flow into fuel, freight and food costs. From there they reach inflation and interest rate expectations, which is why investors watch oil closely.
1990, the 2000s and today
- 1990, the supply shock: Iraq's invasion of Kuwait roughly doubled oil prices within a few months. Prices fell back once the conflict was resolved. It was a sudden supply shock that faded.
- 2003 to 2008, the demand run: oil climbed from about $12 to $145, or roughly $24 to $215 in today's money. It was slow and demand-driven, powered by years of emerging market growth against thin spare capacity.
- Today, a supply shock again: the IEA says more than 10 million barrels a day of Gulf output was shut in during August, and global inventories have fallen 507 million barrels since the war began.
- The offset, falling demand: high prices are already biting, and the IEA expects demand to fall 2.5 million barrels a day this year.
- The real-terms view: $100 is still less than half the 2008 peak once you adjust for inflation.
A fall is more likely than not, but a rise would probably be bigger.
New to investing?
Learn how ETFs work with our free ETF Beginners Course. Start the free course
Four scenarios, with our probabilities
| Scenario | Probability | Brent range | What drives it |
|---|---|---|---|
| Resolution | 30% | $75 to $90 | A US-Iran deal reopens Hormuz. Prices fall, but stock rebuilding stops a return to $65. |
| Gradual easing | 40% | $85 to $100 | Flows improve without a formal deal. The EIA forecasts about $90 for the second half of 2026. |
| Prolonged constraint | 22% | $130 to $160 | Gulf output stays shut in and inventories keep drawing until high prices force demand down further. |
| Wider shock | 8% | $180 to $215+ | Another chokepoint closes or more Russian supply is lost, pushing toward the 2008 real peak. |
These probabilities are our own judgement, not a forecast, and they will change as the facts do.
Reading the numbers
About seven in ten outcomes land at or below today's price. But the upside scenarios sit much further from today than the downside ones, so the probability-weighted average is closer to $110. A fall is more likely than not, but a rise would probably be bigger.
What should you watch?
Four signals will tell us which path we're on:
- US-Iran talks: progress toward a deal is the clearest route to the resolution scenario.
- Hormuz transits: the number of ships moving through the Strait shows whether flows are really recovering.
- Inventory draws: the weekly pace of stock declines shows how much buffer is left.
- Saudi pipeline restoration: how quickly Aramco restores its East-West pipeline affects how much oil can bypass Hormuz.
The key test is early 2027. If Gulf output is still mostly shut in and stocks are still falling by then, a 1990-style spike starts to look like a 2000s-style run.
The takeaway: numbers over narrative
Nobody knows which path we're on. At Total Money Management, the habit we keep coming back to is thinking in ranges and probabilities rather than single-number predictions, and knowing which signals would change the odds.
Frequently asked questions
Could oil return to its 2008 peak?
It would take a much wider shock than today's. Our scenarios put about 8% on prices reaching $180 to $215 or more, which would need something like another shipping chokepoint closing or further loss of Russian supply. That is our judgement, not a forecast.
Why does the oil price affect inflation and interest rates?
Fuel, freight and petrochemicals feed into the cost of goods and services. Higher energy costs can lift inflation, and central banks watch inflation closely when setting interest rates.
What is the difference between Brent and WTI?
Brent is the main international benchmark and WTI is the US benchmark. Brent usually trades at a premium. On September 18, Brent settled at $103.87 and WTI at $100.30.
What would push oil prices down?
A US-Iran deal reopening Hormuz, faster Saudi export workarounds, or weaker demand. Even then, refilling depleted inventories is likely to keep a floor under prices.
Want the weekly view?
Join the Signals & Noise Premium community for deeper market commentary. Find out more
Sources: IEA Oil Market Report, September 2026, EIA Short-Term Energy Outlook, CNBC, Trading Economics, Forbes Advisor
This newsletter is for informational purposes only and does not constitute financial advice. Total Money Management | AFSL 568642.
Enjoying our blog?
Join Signals & Noise, our free weekly newsletter, and stay sharp on the markets and sectors we're tracking.
This newsletter is for informational purposes only and does not constitute financial advice. Total Money Management | AFSL 568642.
Stay connected to our blog
Join our mailing list to receive the latest news and updates from our team including blogs, live events, podcast releases and stocks to watch.
Your information will not be shared.
We hate SPAM. We will never sell your information, for any reason.
