Tech Market Concentration in 2026: What History Teaches Investors
Oct 02, 2026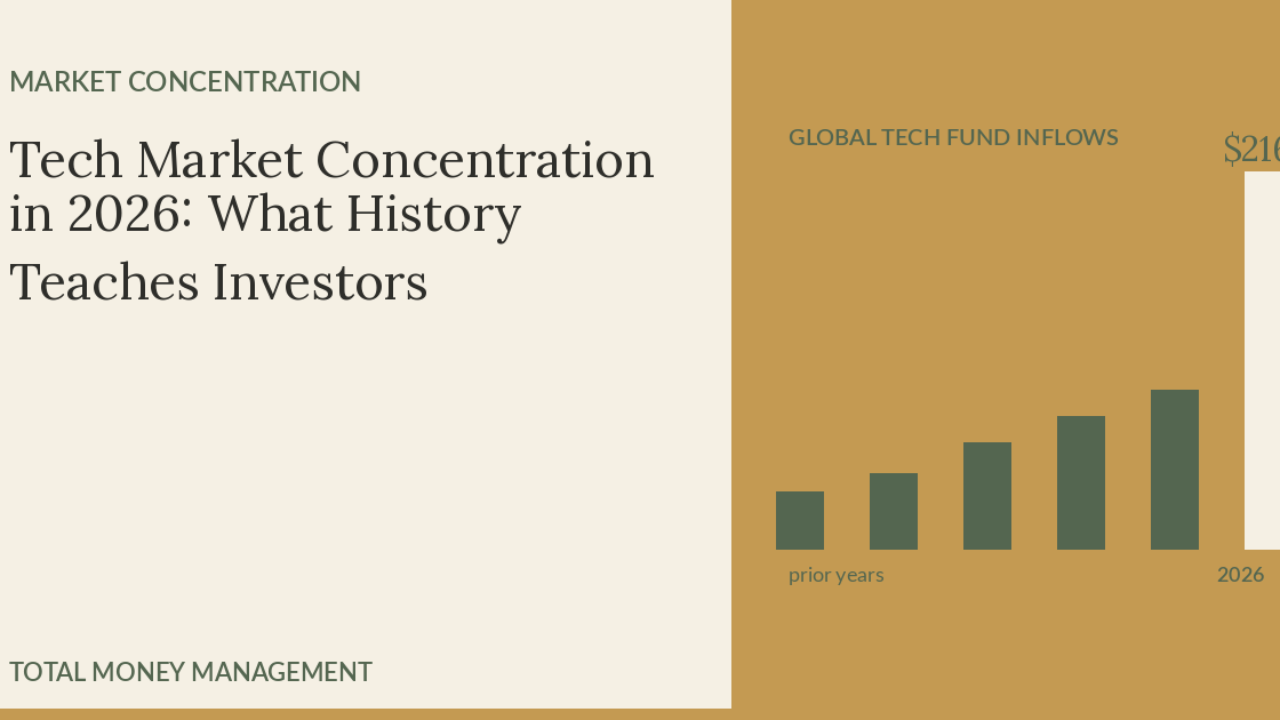
Global investors have put a record amount of money into technology funds this year. The pace of inflows is annualising at around $216 billion, easily clearing the previous full year record of roughly $81 billion. On a chart, this year's line does not just edge past prior years. It towers over them.
That shape has a name in markets: parabolic. It shows up when a story stops needing new evidence to keep going, because capital is already rushing in, which makes the story look more true, which brings in more capital. It has happened before, in different sectors, under different company names. This is not a call that the top is in. It is a look at the numbers, and at what history says tends to happen when a chart looks like this one.
The numbers behind this year's tech rally
A few figures are worth sitting with before going further.
Technology fund inflows are on track for about $216 billion this year, a fourth consecutive annual increase and well clear of the prior record. The concentration inside the share market has also grown. The top 10 stocks in the S&P 500 now make up roughly 35% of the index. At the peak of the dot-com bubble in 2000, that figure was closer to 25%. The so-called Magnificent Seven alone now hold a larger share of the index than the top seven companies did at the 2000 peak.
Valuation has moved with it. The Shiller CAPE ratio, a measure that compares share prices to ten years of average earnings, sat at around 41 in mid-2026. That is the second-highest reading in 125 years of data, against a long run median of about 17.
Why this is not a simple repeat of 2000
It would be easy to stop at those numbers and assume history is about to repeat itself exactly. It is more useful to look at what is different too.
The companies leading this rally are, in the main, genuinely profitable. Nvidia's net margin sits at roughly 53%, and its revenue for the 2026 financial year came in at close to $216 billion. Compare that with the dot-com era, when only around 14% of listed technology companies were actually profitable at the peak. Price to earnings ratios today, while elevated, are also well below the extremes reached in 2000. Nvidia trades on a forward multiple in the mid-20s. Cisco, one of the defining stocks of the dot-com run, traded at close to 472 times earnings at its 2000 high.
So two things are true at once. On earnings quality, this cycle looks nothing like 2000. On index structure, meaning how much of the market's total value sits in a small handful of names, and how fast capital is arriving, the resemblance is hard to argue away.
What concentration actually means for a portfolio
This matters beyond the headlines because of what concentration does to risk, not because of any single company's prospects.
When a small number of stocks make up more than a third of a major index, an index fund investor is making a much larger bet on those few names than the words "diversified fund" might suggest. That is not necessarily a mistake. It simply means the diversification most people assume they have may be thinner than it looks on paper.
History's pattern with parabolic moves, across sectors and decades, is not that they are always wrong. Some run further than sceptics expect. The consistent lesson is different: the entry price you pay for a story matters more than the story itself. Buying into strong growth at a reasonable price has historically behaved very differently to buying into strong growth at any price, because the second approach assumes the market will keep paying a premium indefinitely.
Questions worth asking, not answers to chase
None of this is a signal to buy or sell anything specific. It is a prompt to check a few things in your own portfolio and thinking.
First, know how concentrated your actual exposure is. If most of your growth assets sit in a broad index fund, check what share of that fund's return is coming from a small number of holdings. Second, separate the story from the arithmetic. A business can be excellent and still be a poor investment if too much future growth is already priced in today. Third, remember that "the market" and "your portfolio" are not always the same risk. Position sizing and diversification exist precisely for moments like this one, not for calmer ones.
The bottom line
Record inflows and rising concentration are facts, not forecasts. They tell you where enthusiasm currently sits, not where prices go next. What history offers is a reminder to separate the quality of a story from the price being asked for it, and to know your own exposure well enough that a single sector's turn, in either direction, does not surprise you.
We track positioning and concentration risk like this every week in Signals & Noise, our free newsletter, and go deeper on it on the TMM podcast.
This newsletter is for informational purposes only and does not constitute financial advice. Total Money Management | AFSL 568642.
Enjoying our blog?
Join Signals & Noise, our free weekly newsletter, and stay sharp on the markets and sectors we're tracking.
This newsletter is for informational purposes only and does not constitute financial advice. Total Money Management | AFSL 568642.
Stay connected to our blog
Join our mailing list to receive the latest news and updates from our team including blogs, live events, podcast releases and stocks to watch.
Your information will not be shared.
We hate SPAM. We will never sell your information, for any reason.
