Why Bull Market Headlines Only Tell Half the Story
Sep 25, 2026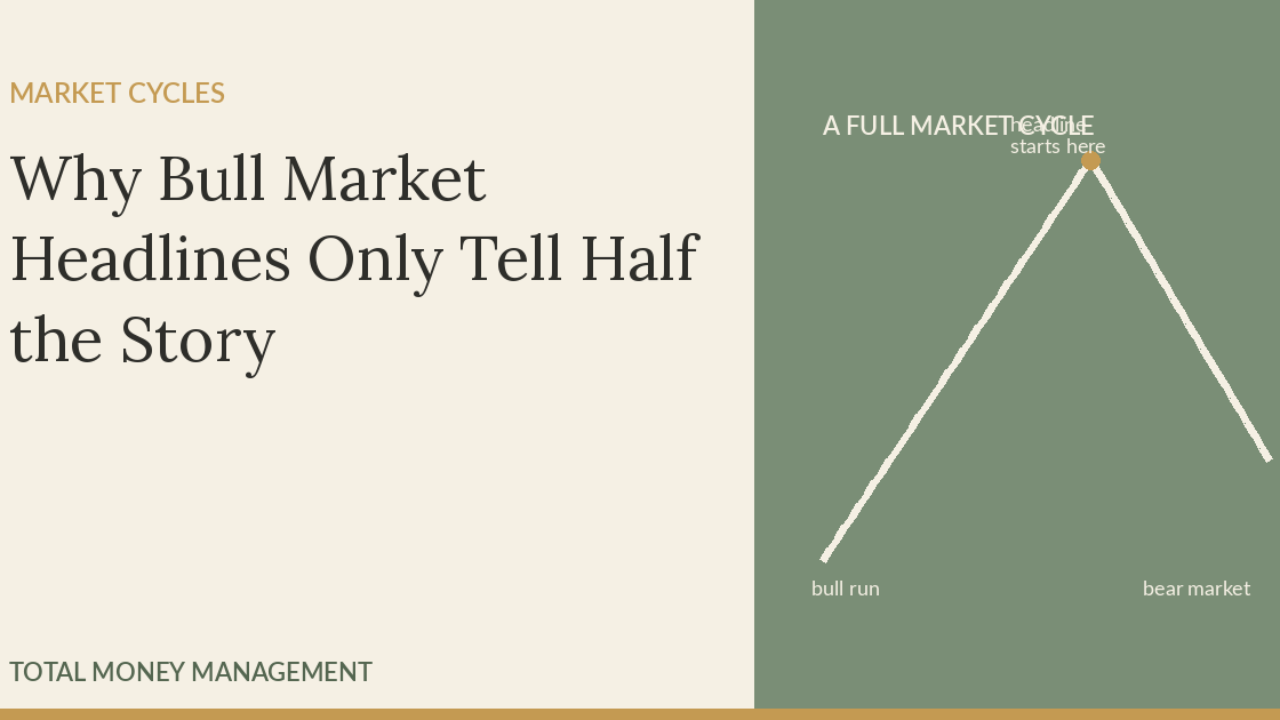
Why Bull Market Headlines Only Tell Half the Story
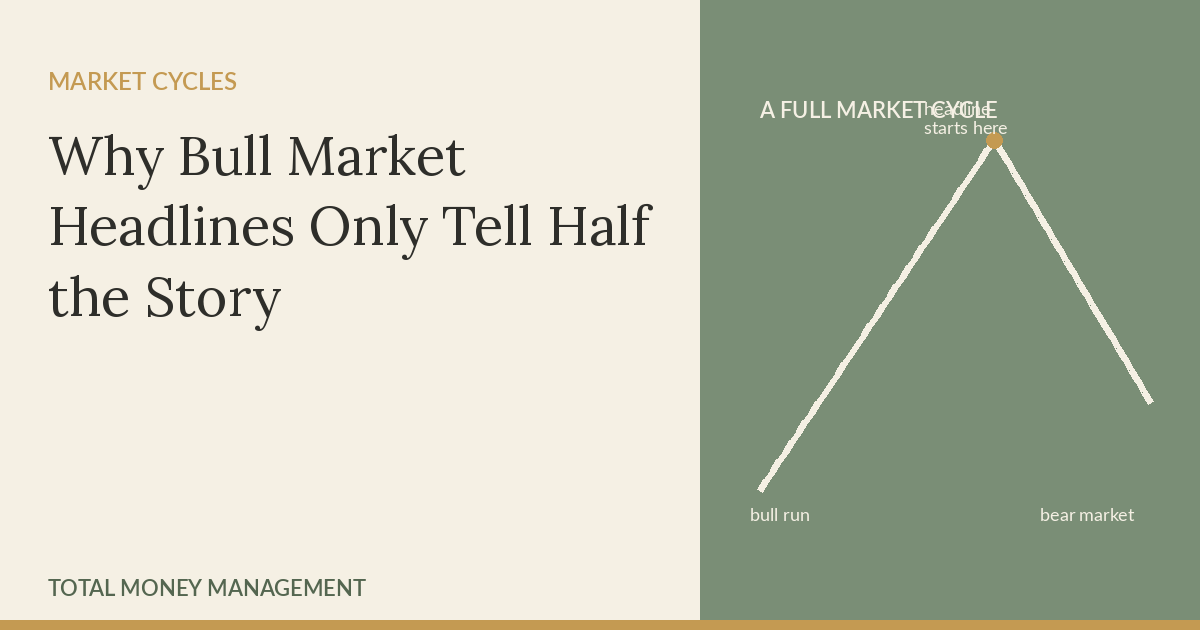
Every few months a headline does the rounds: the market is up some huge percentage since its last low. It sounds like proof that stocks are a one way bet. It isn't. A bull market run is only half a cycle, and looking at half a cycle gives you half the information you need.
What "the market is up X%" leaves out
A bull market headline picks a starting point at the bottom of the last crash and measures to today. That is real math, but it is also cherry picked math. Nobody buys at the exact bottom and holds to the exact top. Most people are invested across the whole cycle, bull and bear, and that full cycle number tells a very different story to the one in the headline.
This matters because the number you see quoted shapes how you feel about risk. A "market up 500%" headline makes staying fully invested at any valuation feel obvious. A full cycle chart, one that shows the bull run and the bear market that eventually follows it, tends to be more sobering.
A full market cycle has two halves
Markets move in cycles that roughly follow four phases: accumulation, markup (the bull run), distribution, and decline (the bear market). The bull run is the part that makes headlines. The decline is the part that gets forgotten once enough time has passed.
Two recent cycles show this clearly.
The dot-com cycle
Through the late 1990s the S&P 500 climbed hard on the back of the internet boom. From its close on 24 March 2000, the index then fell 49.1% over the following two and a half years, bottoming out in October 2002. Anyone who only remembers the 1990s boom is remembering half the cycle.
The 2008 cycle
The market rallied again through the mid 2000s, this time fuelled by cheap credit and a housing boom. From its October 2007 peak, the S&P 500 fell 56.8% by March 2009, wiping out years of gains in under a year and a half. That crash is also the starting point most "market is up hundreds of percent" headlines use today, because it happens to mark a major bottom.
What this means for how you look at returns
None of this is a call on where markets go next. Nobody can reliably time when a bull run ends or how long a bear market lasts. But there are a few things worth sitting with.
A number that only measures from a low point will always look more impressive than a number that measures a full cycle, because it leaves the down years out entirely.
The length of the current bull run does not tell you much about the length of the next bear market, or when it starts. History says bear markets follow bull markets. It does not say when.
The investors who do best over a full cycle are usually the ones who built a plan for both halves of it, not just the half that was already behind them when they started paying attention.
The takeaway
Headline returns are not wrong, they are just incomplete. Before you let a big percentage change how you feel about your own portfolio, ask what period it is measuring, and what the other half of that cycle looked like last time around. That question does more for how you think about risk than the headline ever will.
If this kind of thinking is useful, we cover full market cycles and how to read risk properly, every week, in Signals & Noise, our free weekly newsletter. We also unpack topics like this in more depth on the TMM podcast.
This newsletter is for informational purposes only and does not constitute financial advice. Total Money Management | AFSL 568642.
Enjoying our blog?
Join Signals & Noise, our free weekly newsletter, and stay sharp on the markets and sectors we're tracking.
This newsletter is for informational purposes only and does not constitute financial advice. Total Money Management | AFSL 568642.
Stay connected to our blog
Join our mailing list to receive the latest news and updates from our team including blogs, live events, podcast releases and stocks to watch.
Your information will not be shared.
We hate SPAM. We will never sell your information, for any reason.
